Every Dragy post or track slip posted on social media these days mentions Density Altitude:
"Conditions weren't great, DA was 5,432."
"Pulled this on a 7,200 DA day, imagine sea level."
Half the people saying it don't actually know what DA is or what it means. The other half are posting it precisely because they know, and they want you to gape and awe at their achievement. But the reality is different, and much like dyno correction factors, there is important context that matters.
If you don't care for the math and want to take our word for it, here's the conclusion:
For most boosted cars - the effects of altitude are overcome by the turbo doing what it was literally designed to do.
The remaining two components of DA paint the real picture, and a car running a full frame turbo on a 7000ft DA summer day in Denver is, based on the math, no more handicapped than if it were in Houston at 1500ft DA. And on a cold winter day where Denver reads 4000ft DA and Houston is -1000ft DA, the Denver car has the advantage. That's not just me saying that because we're in Houston - it's just a cold hard fact and one that most people don't want to accept.
What Density Altitude Actually Is
Density altitude (DA) is the elevation, in the standard atmosphere, where the air has the same density as your actual current conditions, wherever you are. It's a way of compressing three real-world variables, pressure, temperature, and humidity, into a single number that you can compare across days and locations.
The reference atmosphere is the International Standard Atmosphere (ISA), which sets sea-level conditions at 15°C (59°F) and 1013.25 mb (29.92 inHg), with temperature dropping 1.98°C per 1,000 ft as you climb [1]. Aviation invented DA because aircraft performance, lift, prop thrust, climb rate, all depend on air density. Luckily for us, aerospace engineers solved that problem with the use of turbochargers on those big, 27L V12 airplane engines in the 1920s. Much like the automotive industry adapted the use of turbochargers in cars, tuners, racers and enthusiasts reference DA because air density is also exactly what your engine cares about: more dense air means more oxygen per intake stroke, which means more fuel can be burned, which means more power.
The Components
DA combines three things:
- Pressure altitude: the altitude where standard atmosphere pressure equals your current station pressure.
- Temperature deviation from ISA: hot air is less dense than cold air. Every degree Celsius above the ISA temperature for your pressure altitude adds roughly 118.8 ft of DA.
- Humidity: water vapor weighs less than the dry air it displaces, so humid air is slightly less dense.
The NWS publishes a dry-air approximation that's accurate to within a few percent for most conditions [2]:
Pressure altitude itself is derived from the local altimeter setting (in mb or inHg) and your field elevation [3]:
That's the whole math. Two formulas. Now let's run real numbers.
DA at Sea Level vs DA at Altitude
We chose Houston because we at Racebox live here, its got a huge car scene, and Houstonians love to complain about the heat and humidity and how it hurts power. We chose Denver for the same reason: the Mile High City residents love to complain about their thin air, and high DA.
Below are the actual full-month average morning conditions from August and January 2025 for both cities, pulled from the Iowa Environmental Mesonet ASOS archive at KHOU (Houston Hobby, 46 ft elevation) and KDEN (Denver International, 5,431 ft elevation), 5am to 9am local time, when most of you are out running your Dragy's [4].
| Aug 2025 morning avg (5-9am local) | Houston (KHOU) | Denver (KDEN) |
|---|---|---|
| Air temperature | 81.3°F | 66.4°F |
| Dewpoint | 74.9°F | 50.4°F |
| Altimeter setting | 30.01 inHg | 30.21 inHg |
| Station pressure | 14.71 psia | 12.15 psia |
| Pressure altitude | −33 ft | 5,166 ft |
| Density altitude | 1,432 ft | 6,871 ft |
| Sample size | 169 hourly METARs | 184 hourly METARs |
| Jan 2025 morning avg (5-9am local) | Houston (KHOU) | Denver (KDEN) |
|---|---|---|
| Air temperature | 48.2°F | 20.6°F |
| Dewpoint | 41.3°F | 11.2°F |
| Altimeter setting | 30.24 inHg | 30.11 inHg |
| Station pressure | 14.83 psia | 12.11 psia |
| Pressure altitude | −249 ft | 5,259 ft |
| Density altitude | −1,019 ft | 3,964 ft |
| Sample size | 207 hourly METARs | 218 hourly METARs |
At first glance, and to someone who gets their information from the Dragy Talk page on Facebook, Denver residents are at a massive disadvantage. Cue all the Denver B58 and VR30 boys claiming their Dragy times in winter show that their cars would be so many tenths quicker in Houston in the summer. The numbers say the gap is real and it's about 5,000 ft of DA in either season.
And that is the case for every naturally-aspirated engine out there. In fact, an NA car would suffer a 15% power loss going from Houston to Denver in the summer. DA is a useful number for those cars, as are the dyno correction factor standards like SAE and STD, which were developed for NA engines.
But if you're on our website and reading this blog, you probably don't have an NA car. In fact, you probably have a B58, S58, or VR30, and the above 15% loss doesn't apply to you, as much as your buddies at altitude might tell you it does. In reality, while the altitude matters (Denver sits at about 2.6psi less atmospheric pressure than Houston), as long as your turbo can overcome it, the temperature and humidty take a much bigger toll on power.
Why boost changes this story
Your engine doesn't care about DA. It also doesn't care about what the ambient pressure is. All it cares about is what the charge density is - that is, the density of the air entering your cylinders. It reads manifold absolute pressure (MAP). If you can hit the same MAP at altitude that you hit at sea level, you make the same cylinder fill, same combustion event, same power (within reason). The only question is whether your turbo can compress the thinner ambient air hard enough to deliver that MAP. The trade-off is higher heat generated, and running out of wastegate/turbine. Things like compressor efficiency, charge temperatures, and humidity affect this as well, but we'll get into that.
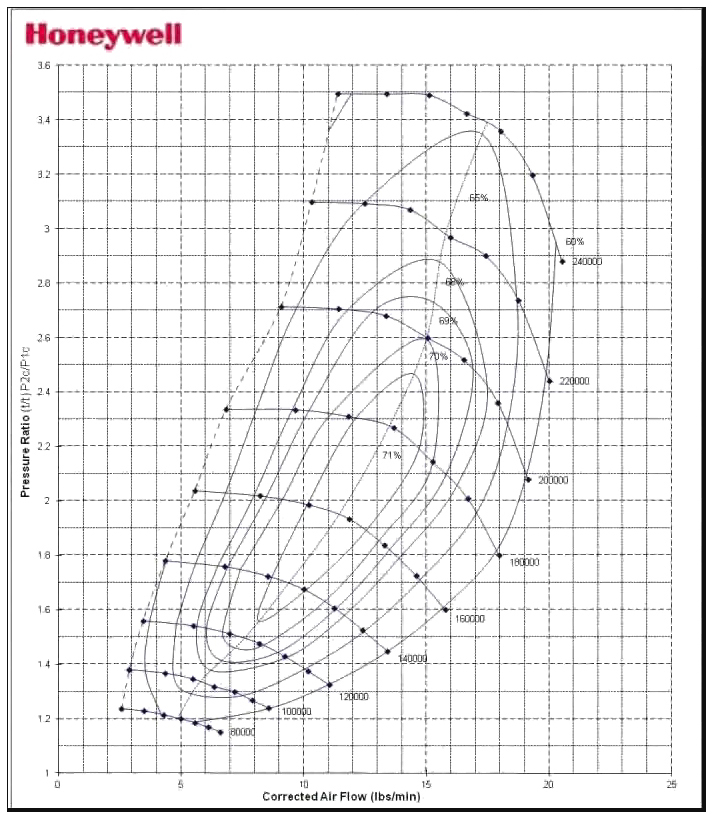
6870 sized turbos are extremely popular for the 7-900whp crowd, and the BMR B58 Lightning Turbo Kit we sell uses one. Let's walk through the numbers for a B58TU on a 68mm CEA-class turbo (PTE 6870 NextGen / Gen 2 family, CM-68-0001 map shown below, 68.02mm inducer / 92.46mm exducer / 54.125 trim) [5][6]. Say the tune targets 35 psi of boost, which is roughly 50 psia MAP at sea level. This is a common set-up that we, and other shops, do all day long. This is a solid 750-800whp car on a properly tuned B58TU tune.
| Location | Ambient Pressure | Boost | MAP | Compressor PR |
|---|---|---|---|---|
| Houston summer morning | 14.71 psia | +35 psi | 49.71 psia | 3.38 |
| Denver, same gauge boost | 12.15 psia | +35 psi | 47.15 psia | 3.88 |
| Denver, same MAP target | 12.15 psia | +37.6 psi | 49.71 psia | 4.09 |

Above is the PTE 68mm compressor efficiency map. Compressor maps are useful in looking at if the cold side of a turbo is working too hard (out of efficiency/headroom) at a given pressure ratio (PR).
The PTE 68mm map peaks at 76% efficiency around PR 3.0. The 74% island extends to PR 3.5. The 72% island extends to PR 4.0. The 70% island reaches PR 4.5. Speed lines run from 46,900 rpm at the bottom to 128,300 rpm at the top, and the surge line clears PR 5.0 at the high end. Basically, the map has tons of headroom.
- Houston, PR 3.38: the operating point sits in the ~75% efficiency island.
- Denver, same MAP target, PR 4.09: the point shifts up to the ~72% efficiency island. Nowhere near surge, nowhere near choke.
Net effect on a 68mm: about 3 points of compressor efficiency lost (75% → 72%) across that 2.56 psi of station pressure delta. The turbo couldn't care less. It just spools a touch harder and lives further up on its shaft speed.
What Actually Happens to the 68mm Car at Altitude
Compressor efficiency is one piece. The bigger story is what happens to charge temperature after the compressor and after the intercooler, because that's what determines how dense the cylinder fill actually is. Run the math through the four scenarios at the same MAP target of 49.71 psia (35 psi gauge at Houston summer reference).
Compressor outlet temperature follows the standard non-isentropic compression equation [7]:
Where T values are absolute (Rankine), 0.286 is (γ−1)/γ for air, and ηc is the compressor isentropic efficiency read off the map at the operating point. Then the intercooler removes heat per its effectiveness rating [8]:
For a properly sized A2W intercooler running on a B58TU big turbo build (we use the RK Autowerks B58TU Race Billet Intake Manifold with Port Injection), 80% effectiveness is the defensible mid-point of the industry range [9][10][11].
| Scenario | T_amb | PR | η_c | T_post-comp | T_post-IC | Charge density vs HOU summer |
|---|---|---|---|---|---|---|
| Houston summer | 81°F | 3.38 | 0.75 | 382°F | 141°F | 1.000 (ref) |
| Denver summer | 66°F | 4.09 | 0.72 | 428°F | 138°F | +0.5% |
| Houston winter | 48°F | 3.35 | 0.75 | 328°F | 104°F | +6.6% |
| Denver winter | 21°F | 4.11 | 0.72 | 354°F | 88°F | +9.7% |
It's true that a turbo working further out of efficiency, at a higher PR, necessarily produces more heat. The post compressor temps, pre-intercooler, are significantly higher. But lucky for us, we don't run turbo cars without intercoolers. And lucky for you guys in Denver, your 7000ft DA summer days don't come with the heat and humidity of a 1500ft DA day in Houston.
In summer, the post-IC IAT is essentially identical between 1500ft DA Houston and 7000ft DA Denver (138°F Denver vs 141°F Houston, within 3 degrees). The cooler Denver ambient feeding the intercooler compensates almost exactly for the higher PR adiabatic heating. And that higher PR is already accounting for the 2.6psi drop in pressure. So we have the same MAP, same charge temperature, same charge density.
Now stay with me here, I know this is hard to accept: the 68mm car is making the same power in summer regardless of which city it's in.
Now look at winter. Denver winter post-IC IAT is 88°F. Houston winter post-IC IAT is 104°F. Denver is 16°F cooler at the same MAP target. That cooler IAT translates directly into denser cylinder fill, which means more O2 per cycle, which means more power.
Charge density follows the ideal gas law (ρ = P / RT). At the same MAP target across all four scenarios, density scales inversely with absolute IAT [7]. Denver winter charge is 2.9% denser than Houston winter. And for those who love to say their winter dragys at 4k DA implicate their cars would run even faster on a 1500ft summer day in Houston: the difference is 9.7%, in favor of the Denver winter conditions.
Then There's Humidity
Air isn't just dry air, it's a mix of dry air and water vapor. Water vapor takes up volume in your charge but doesn't burn. The more humid the air, the less O2 per cylinder fill. Saturation vapor pressure of water follows the Magnus-Tetens formula (WMO standard, used by NWS) [12]:
Run that against each scenario's dewpoint, divide by total ambient pressure, and you get the water vapor mole fraction in the air the compressor is breathing.
| Scenario | Dewpoint | Atmos P | e_water | Water by volume | O2 in charge vs HOU summer |
|---|---|---|---|---|---|
| Houston summer | 75°F | 1014 mb | 29.6 mb | 2.92% | reference (1.000) |
| Denver summer | 50°F | 838 mb | 12.5 mb | 1.49% | +1.5% |
| Houston winter | 41°F | 1022 mb | 8.8 mb | 0.86% | +2.1% |
| Denver winter | 11°F | 835 mb | 2.5 mb | 0.30% | +2.7% |
Houston summer mornings carry 2.9% water vapor by volume. That's why we complain about the heat being "different." You walk outside on a summer morning and are immediately drenched in sweat.
Every cylinder fill at 50 psia MAP in Houston has 2.9% of its volume taken up by water that contributes nothing to combustion. Denver gets a 1.5% O2 advantage in summer just from being drier, and 2.7% in winter when both cities are dry but Denver is bone-dry.
Combined Effect on the 68mm Car
Stack charge density and O2 fraction together. Engine power scales roughly linearly with O2 mass per cylinder fill at the same MAP target.
| Scenario | Charge density | O2 fraction | Net effective power vs HOU summer |
|---|---|---|---|
| Houston summer (ref) | 1.000 | 1.000 | 1.000 (e.g. 800 whp) |
| Denver summer | 1.005 | 1.015 | 1.020 (~816 whp) |
| Houston winter | 1.066 | 1.021 | 1.088 (~870 whp) |
| Denver winter | 1.097 | 1.027 | 1.127 (~902 whp) |
Same 68mm car, same MAP target, Denver in January makes ~13% more power than Houston in August. About 100 whp on an 800 whp build. Denver is also 3.7% better than Houston in winter and within 2% of Houston in summer. There is no scenario where Houston weather actually wins on the 68mm car. The "imagine sea level" excuse on a properly intercooled big-turbo build is plain wrong. In fact, it's directionally backwards.
Notice the biggest deltas in this table are actually temperature related. Houston-vs-Denver same season: 0.5-3% spread. Summer-vs-winter same city: 8-10% spread. The seasonal delta (which is all temp and humidity) is roughly 4x larger than the altitude delta. For a turbo car at fixed MAP, ambient temperature and humidity matter way more than altitude. A car in Houston posting runs in summer is genuinely down on power vs a car showing a DA rated 5000ft higher in Denver during the same season. Same goes for winter, and especially bad when you look at the uninformed masses that claim a Denver car run at 4000ft DA in the dead of winter would beat a Houston car running the same times in the peak of summer at 2000ft DA. It's just plain wrong.
Now Compare a Small Stock Turbo
If you're still reading, great! You already know that NA cars suffer the effects of altitude - they have no way of making up that 2.6psi ambient pressure loss. The same is somewhat true for small turbos that are already well past efficiency in a stock turbo car. I would have loved to toss B58TU data on here, but there is no publicly available compressor chart for the stock turbo.

Fortunately, the guys at Stillen published the stock compressor map for the Q50/Q60 VR30 Honeywell-Garrett turbos [13]. The OE unit is the MGT1446LKSZ ("FZ5t"), Garrett's Modern Gas Turbo line with their low-loss "Z" bearing CHRA. Stock housings run a tiny 0.52 A/R compressor side and 0.53 A/R turbine side [14], a journal-bearing setup that prioritizes spool over flow ceiling. We're using this map since the VR30s make similar power on stock turbos as a stock turbo B58. Not apples to apples entirely since the B58 is a larger, single turbo and would perform better at altitude, but it works for comparison's sake:

Peak efficiency is 71% with the bullseye centered around PR 2.4-2.5 / 14 lb/min. The 70% island wraps a bit further out. The 65% ring reaches up to PR 3.0. The 60% line wraps the whole envelope and falls off into choke past PR 3.5. Speed lines run 80,000 to 240,000 rpm. The whole map is small because each turbo is small. The VR30 is twin turbo precisely because no single turbo of this size could feed a 3.0L motor by itself.
Plot a 430-440whp FBO VR30 on gasoline at 20 psi gauge across the same four scenarios:
| Scenario | Station P | Boost | MAP | PR (same MAP target) |
|---|---|---|---|---|
| Houston summer | 14.71 | +20 psi | 34.71 | 2.36 |
| Denver summer (same MAP) | 12.15 | +22.6 psi | 34.71 | 2.86 |
| Houston winter | 14.83 | +20 psi | 34.83 | 2.35 |
| Denver winter (same MAP) | 12.11 | +22.7 psi | 34.83 | 2.88 |
At Houston PR 2.36 with ~25 lb/min per turbo (typical for 440whp combined), the operating point is already at the right edge of the published map, sitting in the 65-70% region. That's why every VR30 community thread about pushing 20psi+ on stock turbos ends with "you're maxed out." Move to Denver at the same MAP and ask the same turbos to climb to PR 2.86 instead of 2.36. The point goes straight up the map past the 70%, 69%, 68% rings into the 65% region near the upper envelope. Denver winter doesn't save the VR30 the way it saves the 68mm.
The VR30 still hits the MAP target - just with a much higher WGDC, and much less efficiently. Going from Houston PR 2.36 (~70% compressor efficiency) to Denver PR 2.86 (~65% compressor efficiency), the compressor needs about 35% more shaft power to deliver the same MAP. That extra shaft power has to come from somewhere, and on a stock-turbo VR30 it comes from the engine via raised exhaust manifold pressure. The 0.53 A/R turbine is crowding choke at 440whp, so pushing the compressor harder forces the turbine to extract more energy from a higher EMP, which is pumping work the piston pays for on every exhaust stroke.
Stack the compressor inefficiency, the bigger pumping loss, and subtract the small Denver humidity advantage. The net cost on a stock-turbo 440whp VR30 in Denver same-MAP works out to roughly 10 whp at the wheels (~2-3%). That's consistent with what we see on customer cars - VR30s suffer disproportionately from any condition change because the OEM turbos are already crowding their published map ceilings at 20psi. Same engine that runs a 7.0 second 60-130 on a cold sea-level day will run an 8 to 8.5 on a hot sea-level day in Houston. That 1.5 second delta isn't air density alone - it's the whole stack of compressor inefficiency, hotter post-IC IAT through heat soak even on upgraded HX (the B6A Race Spec Heat Exchanger V2 is the upgrade we run on customer VR30 builds for exactly this reason), and ECU timing pulls, all biting at once. Add altitude on top and it gets worse, not better.
Keep in mind we're running the math at peak boost here. Small turbos like the one on the stock VR30 cannot sustain peak boost for long. We drop off to about 28 psia at redline on most cars (13-14 psi boost at sea level), and the losses are likely worse across the powerband as the turbo runs out of steam up top. The 10 whp loss on peak translates to more whp lost as the turbo runs out of steam even faster at altitude - but still better than the 15% an NA car loses across its whole curve.
Why Turbo Headroom Defines the Altitude Penalty
The two calcs above hinge on two things: where the compressor sits on its efficiency map at altitude PR, and how hard the turbine has to push exhaust manifold pressure to deliver the additional shaft work. Both come down to one phrase: turbo headroom.
Compressor headroom is how far the operating point shifts on its map as PR rises. The PTE 68mm at 70 lb/min walks from ~75% efficiency at PR 3.38 to ~72% at PR 4.09 - three points lost. The stock VR30 at 25 lb/min per turbo walks from 70% at PR 2.36 down into the 65% band at PR 2.86, with the operating point landing near the right edge of the published envelope. Bigger compressor wheel and housing equals more headroom equals less efficiency walked off at altitude.
Turbine headroom is how steeply EMP has to rise to make up the additional compressor shaft work. A properly-matched .96 A/R divided T4 housing on a 68mm has so much turbine flow capacity that a 20% increase in compressor work (from ~89 kW Houston to ~107 kW Denver, about +24 hp) might only lift EMP by under a psi at the engine. The stock VR30's 0.53 A/R MGT1446LKSZ turbine is already crowding choke at 440whp - it has to climb its EMP curve much harder for a similar 33% increase in compressor work (~45 kW Houston combined to ~60 kW Denver, about +19 hp), and that EMP rise is what eats into the engine's brake power.
The general principle: bigger compressor + bigger turbine = altitude barely registers. Smaller compressor + smaller turbine = altitude bites both ways, on the compressor map AND on the engine via raised exhaust manifold pressure. Wastegate duty cycle will get you to the same MAP target on most stock turbos at altitude, but you pay for it in efficiency and pumping work.
One mechanism note on EMP rise: when we say altitude raises exhaust manifold pressure, the path is via wastegate duty cycle. The ECU is in closed-loop control on MAP target. To hit the same MAP at altitude, it commands higher WGDC, which drives the wastegate more closed. Less exhaust bypasses the turbine, more is forced through it. The turbine has a fixed flow capacity at given inlet conditions, so pushing more mass through it raises inlet pressure - and that inlet pressure IS the exhaust manifold pressure the engine sees on the exhaust stroke. Closed wastegate = more flow through turbine = higher EMP = more turbine work = more compressor work = boost target hit, but at a real cost in pumping work [Watson & Janota, Turbocharging the IC Engine, Ch. 4].
A caveat on the loss numbers above, with a real citation now. PTE doesn't publish turbine flow charts for the 6870, but Garrett does for their direct competitors. The G35-1050 (68mm/84mm compressor, 68mm/62mm turbine - same class as the 6870) shows 74% peak turbine efficiency on its published exhaust flow chart [15]. Note that 74% is the peak claim across the housing family; it isn't marked at a specific PR/flow point on the chart, and our actual operating efficiency on a well-matched 1.21 A/R T4 housing at peak power is more like 70-72%. The G40 series with the bigger 77mm/70mm turbine wheel hits 76% peak across 0.85-1.19 A/R T4 housings, with operating efficiency in the 72-74% range. Either way, a properly-matched 68-71mm-class big single is genuinely operating at 70-74% turbine efficiency on a B58TU build, which anchors the small ΔEMP and small pumping loss numbers above. The framework is bulletproof - compressor work scales as (PR0.286−1)/ηc, turbine work balances compressor work, EMP rise translates to engine pumping loss - and we now have published peak ηt instead of pure estimation.
The takeaway: if you want to know how altitude affects your specific build's wheel power, the answer is in your turbo's headroom on both sides, not in the DA reading on your phone.
How Big Does the Turbo Need to Be Before Altitude Stops Mattering?
Wrong question. The right question is: is your turbo operating inside its published efficiency map at your power target? If yes, altitude same-MAP doesn't bite. If no - meaning you're already past the right edge of the published map (like a stock VR30 making 440whp) - altitude makes a bad operating point worse.
Garrett publishes both compressor maps AND turbine flow charts for their entire G-series, which lets us check both halves at any power target. Pulled from Garrett's Performance Catalog Vol 9 [15], here's what each turbo looks like at the Denver same-MAP point for its OWN rated power class:
| Turbo | Compressor (in/ex/AR) | Turbine (in/ex) | Rated HP | Peak ηc | Peak ηt (Garrett published) | Verdict at altitude same-MAP |
|---|---|---|---|---|---|---|
| Stock VR30 MGT1446LKSZ (per turbo) | ~50/-/0.52 | small/-/0.53 | ~220hp/turbo nominal | 71% | not published, ~30-40% (off-design) | Past right edge of map at 25 lb/min. Real altitude penalty. |
| Garrett G25-550 | 48/60/0.70 | 54/49/84 | 300-550 | ~75% | ~75% peak | Inside envelope at 500hp same-MAP. Altitude irrelevant. |
| Garrett G30-770 | 58/71/0.72 | 60/55/84 | 475-770 | ~76% | ~75% peak | Inside envelope at 700hp same-MAP. Altitude irrelevant. |
| Garrett G35-1050 | 68/84/0.75 | 68/62/84 | 700-1050 | 76% | 74% peak (published) | Inside envelope at 1000hp same-MAP. Altitude irrelevant. |
| Garrett G40-1150 | 71/88/0.80 | 77/70/84 | 500-1150 | 76% | 76% peak (published) | Comfortably inside at 1100hp same-MAP. Altitude essentially invisible. |
The point isn't "you need a 68mm or bigger." The point is your turbo needs to be operating inside its published map at your specific power target. A G25-550 at 500hp is sitting in its sweet spot - altitude same-MAP doesn't push it past the 70% efficiency island. A G35-1050 at the same 500hp would be even less stressed, just barely loaded. A stock VR30 at 440whp is already past its map's right edge before altitude is even in the picture, and altitude only makes it worse.
So the threshold is power-target-relative, not absolute size. A 350hp Q60 on stock turbos is probably fine at altitude - it's well inside the published envelope. A 440whp tune on the same stock turbos is past the threshold and pays the altitude tax because we're operating off the map's right edge. An 800whp B58TU on a Garrett G35-1050 or G40-1150 is comfortably inside the envelope and doesn't notice altitude. Pick a turbo whose published map covers your power target with margin, and altitude same-MAP becomes a non-issue. Run a turbo past its published envelope and altitude compounds the existing inefficiency.

Garrett G40-1150 catalog page (Performance Catalog Vol 9). Compressor map peak 76% efficiency. Exhaust flow chart peak turbine efficiency 76% across the 0.85-1.19 A/R T4 housing range. Source: Garrett Motion catalog.
So Why Isn't DA the Great Equalizer?
Because DA only normalizes one variable: intake air density on a naturally aspirated engine. Everything else is still in play. The same goes for dyno correction factors.
- Big turbos are insensitive to DA within their efficient operating envelope. A 68mm with a properly sized A2W intercooler in Denver actually makes more power in winter than the same setup in Houston summer.
- DA understates temperature and humidity penalties. Two turbo cars at 2000 DA, one at sea level and 80 degrees with high humidity and one at 60 degrees at 2000 ft elevation experience different challenges. The turbo overcomes the pressure loss, but it doesn't overcome the higher heat and humidity.
- The size of your turbo determines how much DA actually costs you. Big turbos with map headroom: nothing. Stock turbos already at the edge: real, measurable, structural.
- Heat soak on back-to-back pulls. Cooler ambient air means everything recovers to operating temp faster between attempts.
How to Actually Use DA
DA is useful for one thing: comparing the same car's runs across different conditions at the same physical elevation. Did your 60-130 just drop 0.3 seconds? Check the DA delta. If today is 1,000 ft lower DA than last week, that explains some of it. Compare your runs at similar DA, ideally within ~500 ft of each other.
What DA is not useful for: extrapolating to "imagine sea level," normalizing a power figure across two cars on two different dynos, and internet racing in general. It's all bullshit.
Next time someone with a 68mm posts "DA was 5,432, imagine sea level," ask them to overlay their MAP target at altitude on their compressor map, and to show you what their post-IC IAT actually was at that ambient. The answer will be that their turbo is fine and their charge was the same as Houston, or in winter, denser. Their excuse is not.
Click to expand: Full data table, formulas, and sources used in this article
Weather data
Iowa Environmental Mesonet ASOS archive [4]. KHOU (Houston Hobby, elev 46 ft) and KDEN (Denver International, elev 5,431 ft). Hourly METAR observations, August 2025 and January 2025, filtered to 5-9am local time. Sample sizes: KHOU Aug 169 / Jan 207, KDEN Aug 184 / Jan 218.
| Variable | HOU Aug morning | DEN Aug morning | HOU Jan morning | DEN Jan morning |
|---|---|---|---|---|
| T (°F) | 81.3 | 66.4 | 48.2 | 20.6 |
| Dewpoint (°F) | 74.9 | 50.4 | 41.3 | 11.2 |
| Altimeter (inHg) | 30.01 | 30.21 | 30.24 | 30.11 |
| Station P (psia) | 14.71 | 12.15 | 14.83 | 12.11 |
| Pressure altitude (ft) | −33 | 5,166 | −249 | 5,259 |
| Density altitude (ft) | 1,432 | 6,871 | −1,019 | 3,964 |
Formulas used
- Pressure altitude: PA = elev + 145366.45 × (1 − (altimeter_mb / 1013.25)0.190284). Source: NWS [3].
- Density altitude (NWS dry-air approximation): DA ≈ PA + 118.8 ft/°C × (Tactual − TISA at PA). Source: NWS [2].
- Compressor outlet temperature (real, non-isentropic): Tout = Tin × [1 + (PR0.286 − 1) / ηc], with T in absolute units, γ = 1.4 for air. Standard turbocharger thermodynamics, covered in any IC engine textbook (Heywood, Watson & Janota, Stone).
- Intercooler effectiveness: ε = (Tin − Tout) / (Tin − Tamb); rearranged to Tpost-IC = Tamb + (1 − ε) × (Tpre-IC − Tamb). Standard heat exchanger NTU method, covered in any thermo textbook.
- Charge density (ideal gas): ρ = P / (R × T). At fixed MAP, ρ ∝ 1 / TIAT,absolute.
- Saturation vapor pressure (Magnus-Tetens, WMO standard): esat (mb) = 6.112 × exp(17.67 × TC / (TC + 243.5)). Source: WMO No. 8 [12].
- O2 mole fraction in moist air: 0.2095 × (1 − water_mole_fraction). 0.2095 from US Standard Atmosphere.
Compressor isentropic efficiency reads (off published PTE maps)
| Operating point | ηc read | Source map |
|---|---|---|
| PTE 68mm at PR 3.38, ~70 lb/min (HOU summer point) | 0.75 | CM-68-0001 |
| PTE 68mm at PR 4.09, ~70 lb/min (DEN same-MAP) | 0.72 | CM-68-0001 |
| PTE 68mm at PR 3.35, ~70 lb/min (HOU winter point) | 0.75 | CM-68-0001 |
| PTE 68mm at PR 4.11, ~70 lb/min (DEN winter same-MAP) | 0.72 | CM-68-0001 |
Sensitivity: ±0.02 on ηc shifts post-IC IAT by ~2°F and charge density delta by ~0.5%. Directional conclusions unchanged.
Intercooler effectiveness assumption
80% transient effectiveness used throughout, sourced from:
- Bell Engineering / cp-eTM ΔCore: 83% measured on N54 sustained-WOT pulls (factory N54 IC measured 58% same test) [9]
- ProCharger published spec: 70-80% best-in-class for their A2A units [10]
- CSF Race X B58 charge-cooler manifold: 15 rows water cooling vs OEM 6, 3× OEM cooling capacity, IATs hold stable at WOT [11]
- RK Autowerks B58 V2 manifold: 70% larger Wagner core than OEM [11]
Sensitivity: at 75% IC eff, post-IC IATs shift +10°F across all scenarios but the city-to-city delta is unchanged. At 85%, IATs shift −5°F across all scenarios, delta unchanged. The comparison is robust to the exact effectiveness number.
Vehicle / build assumptions
- Build: B58TU on a PTE 68mm CEA-class turbo (PTE 6870 family), targeting ~800whp on E85.
- Boost target: 35 psi gauge at sea level, MAP target 49.71 psia.
- Mass flow at peak: ~70 lb/min for the 68mm 800whp E85 build, ~50 lb/min total (25 per turbo) for the 440whp 93oct VR30 build. Estimates use the standard HP/lb-min rule-of-thumb (≈10 for 93oct knock-limited, ≈12.5 for E85 well-tuned with full timing). Cross-checked against in-house Racebox dyno logs at peak power; the rule-of-thumb numbers agree within ~5 lb/min on customer cars we've actually measured. For your own build the tighter math is m_fuel × AFR using injector flow × duty cycle from a peak-power log, which gets to ±2-3 lb/min if injector spec, fuel pressure, and fuel composition are all known. The PR-based conclusions above are robust to ±5 lb/min flow uncertainty (compressor map operating point shifts a hair but stays in the same efficiency island).
Up Next
This piece is part of a series on dyno and Dragy honesty.
- DynoJet vs Mustang vs Hub Dyno: how each one actually reads, and why the "hubs read low" myth is wrong.
- Dyno Correction Factors Are a Lie: the SAE/STD math run line-by-line on two real B58 customer cars, one at sea level and one at altitude.
- Your Tuner's Dyno Numbers Might Be Meaningless: correction-factor abuse, baseline cherry-picking, and how to read inflated power numbers in the wild.
Sources
- International Standard Atmosphere, Wikipedia / ICAO Doc 7488
- National Weather Service, Density Altitude calculator and formula (NWS El Paso)
- National Weather Service, Pressure Altitude calculator
- Iowa Environmental Mesonet ASOS archive (KHOU and KDEN hourly METAR observations, August 2025 and January 2025)
- Precision Turbo & Engine, published compressor maps (CM-60-0001, CM-64-0001, CM-68-0001, CM-76-0001)
- Precision Turbo & Engine, Next Gen 6870 product page (1,200 hp 68mm CEA class)
- Heywood, J.B., Internal Combustion Engine Fundamentals, 2nd ed., McGraw-Hill, 2018 (general reference for turbocharger thermodynamics; specific equations are textbook-standard, not unique to this author)
- Incropera, F.P. et al., Fundamentals of Heat and Mass Transfer, 8th ed., Wiley, 2017 (general reference for heat-exchanger effectiveness/NTU method; same caveat)
- Front Mount Intercooler Efficiency Test Data (engine basics, BMW N54 OEM vs cp-eTM ΔCore measured effectiveness)
- ProCharger, Air-to-Air Intercooling Advantage (70-80% effectiveness spec)
- CSF Race, Ultimate B58 High-Performance Heat Exchanger + RK Autowerks B58 Manifold Gen2 (A2W charge-cooler product specs)
- World Meteorological Organization, WMO-No. 8, Guide to Meteorological Instruments and Methods of Observation (Magnus-Tetens saturation vapor pressure formula)
- Stillen, Honeywell-Garrett VR30DDTT stock turbo compressor map
- Racebox / Z1 VRX70B Q50/Q60 Turbochargers product page (stock OE A/R reference: 0.52 compressor, 0.53 turbine; cross-verified against VR Kingz Performance VRX60B product page) plus Concept Z Performance, "A closer look at the VR30DDTT's Turbochargers" (Nick Letsom, December 2016, hands-on inspection identifying part number MGT1446LKSZ)
- Garrett Motion, Performance Catalog Volume 9 (March 2023) - G25-550 (page 15), G30-770 (page 18), G35-1050 (page 21), G40-1150 (page 23) compressor maps + exhaust flow charts including peak turbine efficiency labels


